


Right now, the story of the spreadsheet is being used to prove two opposite things about AI. The reassuring version: VisiCalc wiped out the bookkeeper, and yet accountants multiplied, so AI will bump the rest of us up to more interesting work. The alarming version: that same spreadsheet taught business to see a company as a grid of cells to be optimised, and helped hollow out firms like Boeing and GE. Same machine, same history, opposite morals. That contradiction is the most revealing thing about historical analogies, and it is what this series is about: the lesson gets picked first, and a history is fitted to it afterwards.
TL, DR: New here? This is the first in an occasional series pulling apart the historical analogies people reach for when they argue about AI. First up: the spreadsheet. The popular version says it destroyed the bookkeeper while accountants thrived, so AI will do the same for us. That is true as far as it goes, but it leaves a lot out. The bookkeepers and the accountants were mostly different people, with very different fates. And the same spreadsheet gets blamed for the 1980s buyout boom that hollowed out companies. The point is not which analogy is right. It is that analogies choose their moral first and find a history to fit.
I’m a keen reader of the many historical analogies that proliferate around AI, but as a historian, they make me want to check the sources and develop a richer historical context. There are so many of them; I keep discovering more, and I suspect it is beyond the ability of a single human to keep up with them all. As a genre, it has simply exploded. So I am starting a series to unpack what they can and can’t tell you about AI.
The rise of historical analogies reminds me of the sudden interest in the Great Depression after the 2008 Financial Crisis. But these were still the early years of social media, so many remained in the journalistic domain and were generally well-researched and based on long-form treatments (mostly academic, some journalistic). The standard history of financial crises was dusted off again.
This time round, it is a little different because everyone suddenly writes historical analogies, frequently to promote their services or make a living on Substack, and the quality and transparency of their research are… well… mostly focused on producing a compelling story and argument.
Narrative is narrative, right? Never mind that one is fictional, the other historical. Some serious academics make that argument.
But I don’t buy it.
And I think historical analogies are a great way to illustrate why they really aren’t.
Full subscribers get the first read, and I’d love your comments and ideas. After two weeks, I’ll make them freely available and repost them on LinkedIn, because having historians weigh in on overused historical analogies might just be quite important and maybe a public service highlighting the value of the humanities and social sciences.
Catch-up service:
The Analogies
There are so many, and they are used to argue that we should be wary of the threats of AI as much as that we should be optimistic. Let’s start with the one I most enjoyed reading and researching recently…
The spreadsheet
Disclaimer – I love a good spreadsheet. The spreadsheet analogy is mostly used to reassure people about artificial intelligence and jobs. It goes like this:
In 1979, a Harvard MBA student named Dan Bricklin grew tired of recalculating ledgers by hand and built the first electronic spreadsheet, VisiCalc. Within a few years, the spreadsheet had swallowed the work of the bookkeeper, the clerk who spent their days adding columns of figures. And yet the accounting profession did not collapse, but expanded. The machine took over the arithmetic, and the humans moved up to the interesting work. So, this analogy implies that AI will do the same for the rest of us.
Great story, and the historical details are essentially correct. It provides succour to worried university graduates when white-collar automation comes up. The journalist Tim Harford wrote an entire essay about it in 2024: “What the birth of the spreadsheet teaches us about generative AI.”
Many aspects make this an enticing analogy: the humdrum nature of the spreadsheet today makes it quaint and appealing to think about it as revolutionising everything.
The technology story
So, it is a damn fine technology story. Don’t underestimate what the spreadsheet means, not just to the quants folk, but to anybody in a management position. Being a research director in the late teens, spreadsheets became central to my armoury. And I’m a qualitative researcher.
The origin story is well-documented – sadly, nobody told or taught it to me when I was at Harvard Business School in 2007/08, which seems like a shocking oversight for the Business History group there.
Bricklin, a Harvard MBA student, class of 1978, claimed to have come up with the idea while watching a professor erase and rewrite the interlocking figures of a financial model on the blackboard. He imagined what he later called a word processor that worked with numbers. With Bob Frankston, he founded Software Arts and released VisiCalc for the Apple II at the end of 1979.
It turned out to be the first “killer app”, software so useful that people bought the computer in order to run it. Mitch Kapor’s Lotus 1-2-3 (1983) overtook it on the IBM PC, and Microsoft Excel eventually won the market once the graphical interface arrived. Steven Levy captured the cultural moment early, in a 1984 essay for Harper’s that charted the emerging “spreadsheet way of knowledge”, a faith that the world could be captured in rows and columns. The article is great and well worth a read – evoking a period from an adult perspective that I remember only as a child. Charmingly, it also reproduces a simple screenshot of what a VisiCalc matrix actually looks like – because it was still an “out there” concept for many at the time.
The VisiCalc (and wider spreadsheet) story is so appealing given what a moderate, non-revolutionary technology introduction it was. Nevertheless, employment numbers can be linked to it very clearly: since 1980, roughly the moment VisiCalc took off, around 400,000 jobs for bookkeepers and accounting clerks disappeared in the United States, while about 600,000 jobs for accountants were added. The numbers behind it come from a much-shared 2015 episode of NPR’s Planet Money on “Spreadsheets!”.
Basically, an argument by historical analogy is rarely built on the analogy itself; rather, the analogy is chosen to illustrate the outcome.
Harford’s piece provides the bigger picture: the Bureau of Labor Statistics counted some 339,000 accountants and accounting clerks in 1980 and around 1.4 million accountants and auditors by 2022. The mechanism is the interesting and paradoxical thing: When something, in this case accounting, gets cheaper, businesses and consumers buy far more of it. Questions that were once too expensive to ask, the endless “what if we changed this assumption” scenarios, suddenly became trivial, so people asked many more of them. Cheaper analysis produced more demand for analysis, and the humans who could interpret it became more valuable rather than less.
This concept highlights that demand increases as prices drop and explains why, for example, automation has not, overall, eliminated human jobs so far. Automation may be substituting for some human tasks, but this can raise the value of the tasks it cannot do, and when demand for the product is elastic (i.e., you’d happily have more of it if you had enough money to afford it), then you will see a net growth in jobs.
The related analogy is that of the bank teller: cash machines did not reduce the number of bank tellers; their roles just shifted towards more human interaction and advice, and less tallying and reconciling of accounts. So, ATMs reduced the cost of running a branch, banks opened more branches, and for a couple of decades, teller numbers rose rather than fell.
Fear not, spreadsheets and bank tellers give hope
The function of any one of these analogies is not to tell the history but to end with the moral of the story, like in Grimm’s fairy tales. So, it is worthwhile watching for the sleight of hand of the analogy magician when they present you with the history.
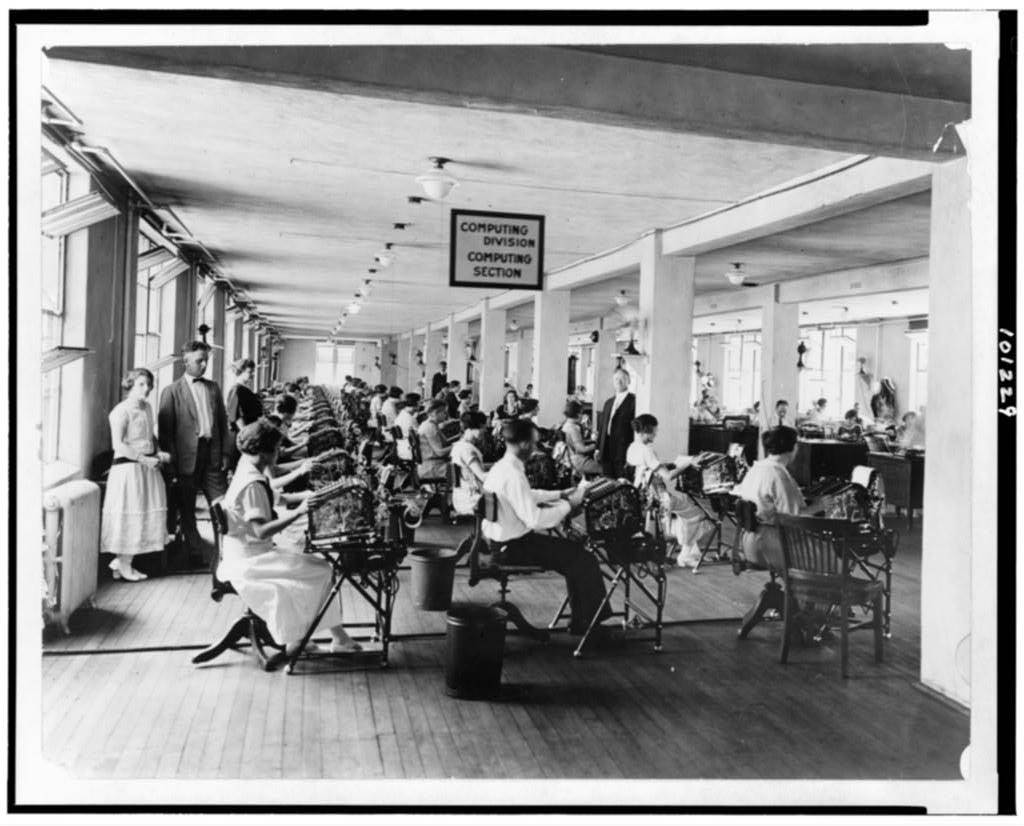
Bookkeeping clerks and accountants are not the same job, really. My mother worked at a bank and then for a tax advisor, essentially as a bookkeeping clerk. She was never a qualified accountant or tax advisor. Instead, she prepared the messy receipts from their clients, who needed endless chasing, and fed that into the database (a software product called DATEV, for anyone who can remember). As a child, I sometimes helped her paste receipts on paper with a Pritt stick while she tallied them on a desk calculator. Bookkeeping, accounting and auditing clerks remain a far larger occupational category than professional accountants. But their numbers have been shrinking, not just because of the spreadsheet, but also because of related innovations, such as enterprise software, outsourcing and the long migration of routine record-keeping into automated systems (once breathlessly promoted as “the paperless office”). The Bureau of Labour Statistics still expects clerk employment to decline, projecting a further 6% decline between 2024 and 2034 as software takes on more routine work. The 400,000-versus-600,000 framing compresses four decades of messy structural change into a single clean swap.
Ergo, “the accountants did fine” is not the same as “the bookkeepers did fine.” A profession can grow in aggregate, while a specific group of people within it loses secure, decently paid work and fails to move up to the higher-value jobs that replace it. The clerk, who was made redundant in 1985, did not generally become a financial analyst. Aggregate flourishing and individual displacement sit comfortably side by side, and an analogy that lumps all this together quietly omits the people who bore the cost of the transition. For starters, my mum, being a bookkeeping clerk, was not coincidental. Many of these jobs were female-gendered, and current AI automation may put at risk roles dominated by women in particular, as Molly Kinder pointed out recently on her Substack.
Finally, the spreadsheet not only redistributed work but also changed what counted as knowledge. Other writers, like David Oks, have argued that by making financial modelling cheap and infinitely revisable, the spreadsheet helped create a particular way of seeing the corporation: as a bundle of assets and cash flows to be optimised rather than an organisation that made things. It powered the leveraged buyout, the rise of private equity, and the long financialization of American business. Michael Milken, the famous junk-bond financier, asked years later to explain the deal-making frenzy of the 1980s, reportedly credited the creators of VisiCalc. This makes the spreadsheet indirectly responsible for the quiet atrophy of companies like Boeing and General Electric that valued financial engineering over the invisible engineering knowledge that created them. The title references James C. Scott’s Seeing Like a State (1998), a book I enjoyed reading in the mid-noughties and only recently realised is widely read and referenced in Silicon Valley tech circles. Which is somewhat odd, given that it argues that systems built to make the world legible from above tend to destroy the local knowledge that made it work.
The Value of Analogies
So: same history – different lessons. It’s almost as if Sting was right that history will teach us nothing. But not so fast. Analogies seek to extrapolate a mechanism for which a history is sought, and that choice was made before the history was consulted, not after. Basically, an argument by historical analogy is rarely built on the analogy itself; rather, the analogy is chosen to illustrate the outcome. Fitting data post hoc is rarely a good approach, and analogies built on this logic only work as long as the audience does not actually know the history referenced. Analogies illustrate mechanisms – claims about why something happened, not whether that mechanism fits the present. The reassuring spreadsheet story rests on the idea that cheaper prices create more demand, but this only works if demand for the product or service is elastic: if something becomes cheaper, you want more of it. If food becomes cheaper, there is a limit to how much more food you are going to consume. If software becomes cheaper, will you be buying more software?
Not all types of technological innovation work this way. The washing machine, another modest technology, made laundry cheaper for households. Instead of consuming more laundry services, households absorbed the work as society moved further towards a self-service economy (a pattern identified by the sociologist Jonathan Gershuny in 1978). With this, an economically value-added sector vanishes from sight in any economic analysis.
So, what is the right analogy for AI? Washing machines or spreadsheets? That is the wrong question. Neither explains in isolation what was happening at the time, because historical analysis, in contrast to historical analogies, is multi-causal: more than one mechanism operates at any one time; they all interact, and, like sound waves, either amplify each other or cancel each other out.
Take Oks’s claim that the spreadsheet was the cause of the dealmaking frenzy of the 1980s. Other significant mechanisms in play include the availability of cheap credit and undervalued equities: you could buy a company for less than the worth of its parts and finance the purchase with cheap borrowed money. Alongside this, the “junk” bond market created access to easy finance. The combination of these factors (alongside political, tax-related, and ideological changes), rather than any spreadsheet acrobatics, is what made the arithmetic of the leveraged buyout work. Having computers running spreadsheets made this more obvious and easier to scenario-plan, but the macroeconomic conditions and financial innovations that created the opportunities were the more fundamental ingredients. Without it, the spreadsheets could not have pointed the path to profit.
Drawing analogies between past dynamics of technology and work isn’t always based on an understanding of historical complexities – rather, they are assembled as illustrations of mechanisms that their authors believe are at play now. They are easy to spot because the nature of their argument is fundamentally different from that of historical explanations: historical analogies normally extrapolate a single causal mechanism. Historical explanations are almost always multi-causal and complex. Because life and technological change in the past felt equally crazy, unpredictable and threatening – much like today.
References
Autor, David H. 2015. “Why Are There Still So Many Jobs? The History and Future of Workplace Automation.” Journal of Economic Perspectives 29 (3): 3-30. https://www.aeaweb.org/articles?id=10.1257%2Fjep.29.3.3
Bruck, Connie. 1988. The Predators’ Ball: The Inside Story of Drexel Burnham and the Rise of the Junk Bond Raiders. London: Penguin.
Bureau of Labor Statistics. Occupational Outlook Handbook: Bookkeeping, Accounting, and Auditing Clerks. https://www.bls.gov/ooh/office-and-administrative-support/bookkeeping-accounting-and-auditing-clerks.htm
Frey, Carl Benedict. 2026. “‘Can a machine do this job?’ is the wrong question.” Financial Times, 14 June 2026.
Harford, Tim. 2019. How computing’s first ‘killer app’ changed everything. 21 May 2019. BBC News. https://www.bbc.co.uk/news/business-47802280
Harford, Tim. 2024. “What the birth of the spreadsheet teaches us about generative AI.” https://timharford.com/2024/03/what-the-birth-of-the-spreadsheet-teaches-us-about-generative-ai/
Kinder, Molly. 2026. “The invisible disruption.” Kinder Futures: Dispatches on AI, work and what comes next, Substack, 10 June 2026.
Kindleberger, C. P. (1978). Manias, Panics And Crashes: A History of Financial Crises. New York: Basic Books.
Levy, Steven. 1984. “A Spreadsheet Way of Knowledge.” Harper’s Magazine, November 1984. https://harpers.org/archive/1984/11/a-spreadsheet-way-of-knowledge/
Oks, David. 2026. “Seeing like a spreadsheet: How the commercial spreadsheet reshaped America.” https://davidoks.blog/p/how-the-spreadsheet-reshaped-america
Planet Money. 2015. “Episode 606: Spreadsheets!” NPR, 27 February 2015. https://www.npr.org/transcripts/389027988
Scott, James C. 1998. Seeing Like a State: How Certain Schemes to Improve the Human Condition Have Failed. New Haven: Yale University Press.
Sumner, Gordon, ‘Sting’ ‘History Will Teach Us Nothing’ from the album ‘Nothing Like the Sun, 1987.
I am very much looking forward to read more of this series on historical analogies for AI! What other analogies are you considering? I hear the calculator a lot, especially in relation to how AI will not make us dumb, but have always felt uneasy about that one.
Love also how a more historically grounded analysis of the analogy quickly brings you to the gendered and class dynamics of technology shifts, immediately made me think of Ruth Schwartz Cowan's "More work for mother". Current employment figures seem to indicate a similar direction: we create new kind of work to replace the one that was automatised, and not necessarly better kind of work.
This was an awesome read. It is always refreshing to see an optimistic view of AI since there has been so much negativity about the topic and so many predictions about it replacing us. In my opinion, history shows that technology is never as simple as the fears expressed. What I liked in particular is the spreadsheet analogy. In the same way as other technologies throughout history, from washing machines to microwaves to Google, AI is a tool that affects the way we do things but does not have to replace our value. Instead, it makes us adapt, evolve and come up with new value creation methods using the tool. I really loved reading this!